A customer base is an important asset for any business. The data collected about customers allows better targeting of communications and preparation of more tailored offers. However, a healthy business needs a steady stream of new customers. In turn, there is usually no (or little) data on them. Where to look for customers? And can data science therefore help in reaching them?
The question posed above is best answered with an example. Some time ago, one company wanted to significantly expand the customer base buying its flagship product. Experience suggested that this product appealed to a completely different group of consumers than the company’s typical customer. An advertising campaign using billboards and flyers was planned. With a limited budget, however, the company did not want to “flood” the entire city and surrounding areas in which it operates with materials. It intended to focus its efforts and budget in locations with the highest probability of high return on investment.
The first idea on how to use data to solve this problem was to see where the current customers purchasing the product were coming from. Their address data was in the database thanks to the loyalty program in place. An analysis of the demographic and behavioral profile of customers buying the flagship item – the subject of the campaign – was conducted. Compared to typical customers, this group was characterized by an overrepresentation of the 30-35 age group by more than 10 percentage points, a higher proportion of men and higher income. It was assumed that particularly attractive from the point of view of the planned campaign would be areas with an above-average share of residents with such characteristics. Therefore, areas (neighborhoods, districts, municipalities) were selected on the basis of several data sources. These came from, among other sources, information made publicly available by the Central Statistical Office and offered commercially by various private providers.
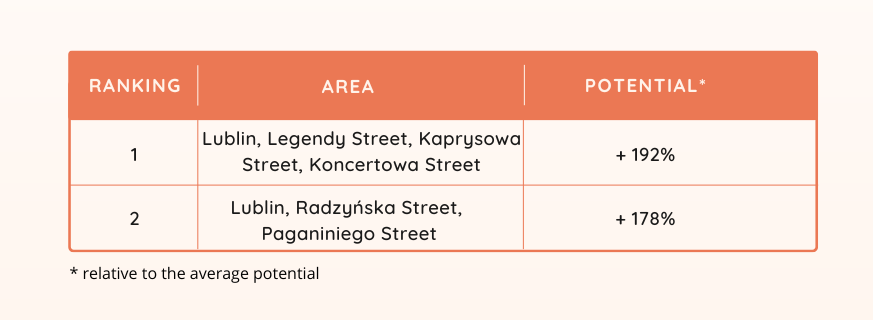
Concerned that simply identifying customer locations of higher interest would not be enough, a more precise estimate of the sales potential of individual locations was needed. In short, an answer was sought to the question: how many sales can we count on? For this purpose, a predictive model was built, which was able to indicate for each area the expected future sales in any defined period. The model used variables such as the age and gender structure of each district, income per household, travel time to the service point, and purchasing behavior of existing customers in the area, among others. The average prediction error of the model varied within +/- 6%. To illustrate the level of detail with which the model was able to pinpoint locations, the following table contains the definition of the top two recommendations of the predictive model.
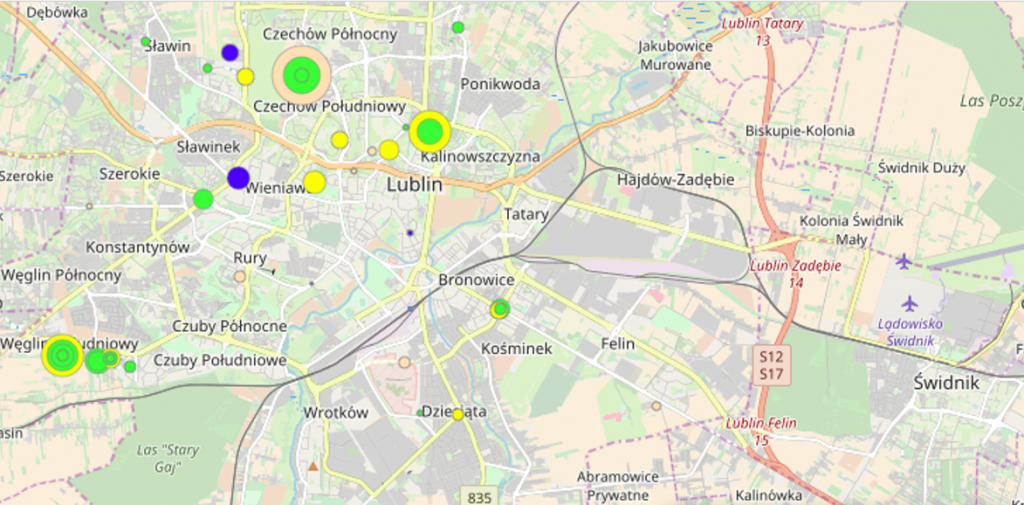
The areas with the greatest potential identified by the model were also visualized on maps (example of one below).
In order to assess the relevance of the model’s recommendations, the effects of the activities carried out in the group of the top 10 locations identified by the model were compared with the 10 locations from places 11-20 of the ranking. The return on investment in the group recommended by the model was more than 21% higher compared to the comparison group.
Data science in the right way, combining internal and external data sources with different levels of detail (individual customer data with aggregated data describing entire areas), can help solve various problems faced by business. Thus, it contributes to increasing return on investment.
Email communication is still the leading channel for direct contact with consumers. There are many examples of companies using this channel to successfully increase consumer engagement and turnover. However, running a campaign too aggressively can result in a decrease in the open rate and positive effects of emails. An overly conservative approach to using mailings can prevent the consumer base from realizing its full purchasing potential. As the number of products being sold increases, customer expectations become more exorbitant, and competition intensifies, optimal campaign planning becomes even more challenging. Fortunately, data science can help.
The recipe for success is simple. You have to send the maximum number of emails to the consumer, not more and not more often, however, than he can bear. You have to send messages to the consumer about potentially the most profitable products, but not ones that don’t interest him at all. Finally, you need to send messages at the right times, both in terms of the consumer’s preferences and the campaign calendar and the need to “spice up” sales. Well, and it would be good not to inform the customer about products he intends to buy anyway. The principles are cruelly simple. So why is their implementation in practice sometimes so difficult?
How to optimize marketing activities – an example
In seeking an answer to this question, we will use the following example, which is very simplified by necessity. A company sells three products A, B and C. Each of them will be the subject of campaigns that will be implemented during the 4-week period under consideration.
Product A will be promoted in week 23, product B will be promoted in all weeks, and product C will be promoted only in the last 24 weeks. Product C is the most profitable for the company – each unit is a 250 PLN margin. For product A and B, on the other hand, it is 100 and 50 PLN, respectively. The above information is summarized in the table.
Product / Campaign week
21
22
23
24
Unit income
A
X
100
B
X
X
X
X
50
C
X
250
Let’s also assume that the company has only 100 customers and each of them has a different preference for shipping frequency. For example, consumer No. 1 accepts a frequency of no more than once every 2 weeks. So a shipment to him can be made either in weeks 21 and 23 or in weeks 22 and 24. Consumer No. 2 is a bit more oversensitive about the frequency of communication and is already inclined to consider dispatches more frequent than once every 4 weeks as excessive spamming. A dispatch to him, therefore, can only be made in one of the 4 weeks, and so on.
Finally, let’s assume that our goal is to maximize the effect for the entire four-week period. And by effect, we mean the total additional sales generated by the campaign. We also assume that no more than one message can be sent to a given recipient in a single week. Thus, in weeks with more than one campaign, we must choose which one we will send. We also do not send more than one message regarding a given campaign to the same customer.
Even with such a modest base: 3 products, 4 weeks, 100 consumers, we have 24 x 3 x 100, or 4800 zero-one decisions to make whether or not to send a given customer a given campaign in a given week. We only need to add one more product and extend the period to 5 weeks and the number of decisions grows to 12800. If we wanted to optimize the calendar for a quarter (12 weeks) with the same number of products and customers we already reach 1638400 combinations. And yet hardly any company has only 100 customers and sells 4 products….
So we see that the number of decisions that need to be made is growing very rapidly. Even for such a small base, it is impossible to make so many decisions manually.
So what do we do in such a situation?
Firstly, we can abandon optimization and send everyone everything always or choose randomly.
Secondly, we can adopt an approximate method, which does not guarantee finding the optimal solution, but gives a chance to find a solution better than random. For example, for each consumer, let’s assign the most profitable campaigns sequentially. However, this intuitive way does not at all guarantee the maximum global effect. Perhaps, given all the constraints we have, for a given consumer it would be better to forgo sending the most profitable campaign and thus have the opportunity to send him two slightly less profitable ones, which, however, will bring higher profit overall.
Thirdly, we can use mathematical programming and advanced optimization engines to find the best possible combination of shipments. It is worth knowing that about 85% of Fortune 500 companies use such methods in their business operations. Examples of the results that in the area of email campaign optimization were achieved with the implementation of such solutions:
more than 30% increase in open rate (thanks to optimized frequency),
more than 6-percent increase in the value of sales in the group targeted in an optimal way compared to the group targeted with simplified decision-making methods,
nearly 50 percent savings in time and human resources when planning campaigns.
Finally, it is worth mentioning that in a world where we send text messages in addition to mailings and contact customers through other channels, the number of possible combinations of decisions is even greater. Therefore, the greater will be the benefits of mathematical optimization. We will also avoid a situation in which a manually arranged plan (which is not optimal anyway) will go awry when one campaign needs to be postponed “just by a week”, and due to problems with the supply of a certain product the volume of messages related to it needs to be reduced by 50%. The human planner will fail to modify the plan in time, or will quit overnight. A properly written mathematical optimization program will handle this task in minutes or hours. At the same time, it will allow to achieve the maximum campaign profit possible under the given conditions and constraints.
The modern consumer is constantly bombarded with messages. Competition for ever-shorter attention spans is bloody, and it’s all about leveraging every possible advantage. How can data science help in the successful battle to get a brand’s message to consumers? Learn the details of using machine learning in marketing communications.
What did marketing communications used to look like?
In the early years of the commercial Internet, when the use of e-mail in marketing communications was just beginning. The task was fairly simple. There was not yet much competition , the freshness effect worked, consumers were more likely to open and read messages. It can be said that just having an address base and executing any mailings was sufficient for success. It was sufficient to follow a simple model somewhat jokingly referred to as “Everything to Everyone Always” (EEA). The name reflects the tendency to send every prepared communication to the entire available addressee base.
The strategy was based on the assumption that every message sent increases the likelihood of a positive response to some degree. And that the cost of sending each additional message is close to zero. In the case of text messages, cost could of course be a limiting factor in the volume of messages sent. In a great many situations, however, this was dealt with simply by proportionally reducing the volume so as to exhaust, but not exceed, the allocated budget.
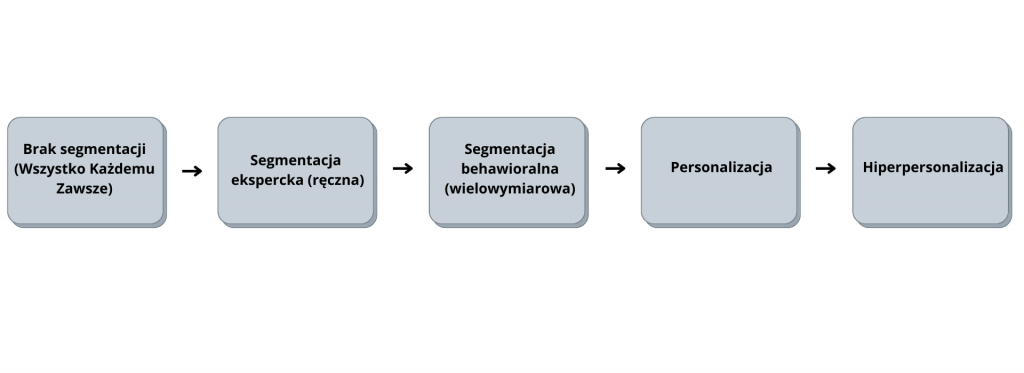
From no segmentation to hyper-personalization
The situation began to change with the increase in the number of brands using email and sms channels for communication. Consumers’ inboxes began to “burst at the seams.” The numbers of messages received exceeded the capacity of perception. Marketing communications in many cases began to be perceived as unwanted (“spam”). The widespread use of the PAC model mentioned earlier also contributed to this. Above all, the lack of customization of content to the specific consumer and too frequent mailings played a role. The seemingly zero cost of mailing (“at most, the customer won’t open it”) did not encourage investment of time and resources in targeting precision. What the calculations did not take into account, however, was that the consumer’s reaction to an overabundance of messages would be a gradual resistance to the message and a declining interest in opening the message.
The first step on the way out was to acknowledge that consumers at the base are not all the same. They have different needs and characteristics. Therefore, the content sent to them should be tailored accordingly. Segmentation of the base began. Manual segmentation based on expert knowledge and predefined segments prevailed. In this approach, the number of applicable consumer characteristics and segments was limited by human capabilities.
Increasing data
As the volume and scope of consumer data collected in databases increased, new opportunities opened up. The new data, combined with the growing computing power and sophistication of machine learning algorithms, made it possible to increase the number of features used in segmentation. Segmentation took on a behavioral character. With a large number of analyzed dimensions, it was able to take into account more complex aspects of consumer behavior and their relationship with the brand. The use of machine learning also made it possible to distinguish and analyze more segments. This, in turn, translated into greater consistency of the groups selected and allowed for better tailoring of communications to the audience.
The next step in the described evolution was the use of predictive models for more personalized tailoring of communications at the individual consumer level. Previously, segmentation allowed operating at the level of groups of consumers. Different segments may have received a different message at a different time, but all consumers belonging to a segment received the same thing. As the level of sophistication of segmentation increased, the number of segments could be larger and consumers assigned to them with greater accuracy. However, the level of generalization was still high, and the room for improvement in precision remained large. The use of predictive scoring models was a significant step forward. The model predicted the probability of each individual consumer’s interest in the subject of a given communication. It could have been, for example, a specific product, a product group, a promotional offer.
Machine learning
Based on consumer behavior data collected in the database, the algorithm learned patterns. Based on these, it was able to predict which of the palette of available messages would most positively influence a particular customer. This ensured that every customer in the database, regardless of the segment assigned to him, was able to receive the most appropriate content.
If, for any of the planned options, the model did not forecast sufficiently high consumer interest, the consumer could be excluded from a given mailing. This allowed a large-scale implementation of the principle that if we don’t have anything interesting to say for you at the moment, we’d better keep quiet. This allowed the consumer to feel that he was getting only news relevant to him. There is no shortage of examples of projects where such predictive models have been implemented. As a result, the perception of the recipients has changed from “stop sending me this spam” to “when will I get another newsletter”.
Using machine learning in marketing communications
The scoring models described, combined with a set of additional, even more advanced models, allow personalization to be taken another step further towards so-called hyperpersonalization. This is characterized by, among other things:
fine-tuning the moment of dispatch. Each consumer can be assigned an ideal moment (in terms of time, day of the week, time since the previous mailing, time since the previous site visit, etc.).
Selection of the best communication channel in conjunction with the ideal moment of dispatch.
Selection of the best combination of channels used (a consumer may, for example, respond best to the combination of an email and a text message sent two days later).
The ability to individualize content elements (e.g., choosing the right words in the subject line, selecting the best photo and other graphic elements.
Dynamic adaptation of the message to the context of the consumer in real time. A different message and channel will be appropriate when the consumer is located in a shopping mall, and another when on the bus on the way to work.
Firstly, it is worth emphasizing that all the above-mentioned personalization takes place on the basis of behavioral patterns that models have “learned” by observing consumers and not on consumer declarations. A customer may declare that he would like to receive mailings on weekday mornings. In reality, mailings sent to him on Saturday evenings are most effective.
Secondly, the maximum power of the described solution comes from the synergy of the individual sub-models of the system. The optimal moment for a given consumer will vary from channel to channel. The optimal sequence and combination of channels may depend on the nature of the promotion being communicated. Finally, the optimal message text may depend on the channel and the location of the user.
Summary
Competition for consumers’ attention will increase as more channels of contact emerge, and it also increases as marketers become more aware of the tools that may be at their disposal. It’s worth asking ourselves at what stage of the described evolution our organization is at, and what we can do to take the next step to gain an additional advantage and not let the competition surpass us.
Many companies have already successfully implemented smart solutions in marketing departments, using data and its advanced analytics. The use of data science solutions increases the efficiency of operations, reduces costs, optimizes budgets and improves ROI. Wanting to remain competitive, other companies need to catch up with the leaders as soon as possible. Where to start? How do you effectively use the data available in your organization? Learn the proven approach of Data Science Logic’s experts.
Customer segmentation
Traditional segmentation approaches are limited as to the number of variables that can be considered. For example, a typical RFM (from recency, frequency, monetary value) considers only three variables. Machine learning methods can segment consumers based on a virtually unlimited number of dimensions. They take into account not only demographic data, but also behavioral data related to both purchasing behavior and consumer interactions at various touchpoints (e.g., web, mailings, app). As a result of segmentation, “personae” are created – typical representatives of the segment, whose characteristics allow to differentiate the approach and plan optimal actions for them.
Prediction of customer value
Machine learning models can predict with a high degree of accuracy the value of a customer throughout its lifecycle. This is possible from the very first (even residual) data about the consumer’s relationship with the company. Of course, the more data, the more accurate the prediction. However, already the initial prediction allows you to decide how much it pays to invest in the relationship with a given customer. This allows you to focus your attention and budget on the most profitable customers.
Anti-churn measures
Machine learning makes it possible to pinpoint customers at risk of leaving. This makes it possible to identify and prioritize customers against whom action needs to be taken. Combined with predictive models of customer value, it is possible to make an optimal decision on how much to invest in retaining a given customer (e.g., in the form of a discount). Using direct communication models, it is possible to find the optimal timing, channel and content of an anti-churn message. The model can also identify a good enough offer for a given customer. For example, if a customer decides to stay after receiving a 5% discount, there is no need to offer him a 15% discount. The predictive model can thus contribute to significant budget savings.
Direct communication planning
Predictive modeling significantly supports the process of preparing and planning marketing communications – not only anti-churn. On the basis of data on consumer interactions with the company, it is possible to predict the positive reaction of a given customer to a specific content, offer, moment and dispatch channel. This allows optimization of the budget – for example, choosing a cheaper channel if the expected effect is similar, or improving the consumer experience – less spam, more tailored content, the most convenient communication channel.
Content analysis and recommendations
Advanced predictive models based on so-called deep machine learning are able to process not only numerical data, but also image, text, sound or video. This makes it possible to predict the effect that the content sent in communications will have on a particular customer. This makes it possible to choose the right content and title of the email, the optimal layout and graphics.
Analysis of the incremental effect of promotion
Promotions and price reductions are an important budget item. Not surprisingly, questions arise about their effectiveness and impact on sales. A simple analysis is often not enough. Reducing the price of a product almost always increases its sales. Just by observing the dynamics of sales during the promotional period, one can conclude that it has worked favorably. Meanwhile, it is necessary to find the answer to the question of how much sales would have been if there had not been this promotion. Only by comparing these two values (actual sales and hypothetical sales without the promotion) can the effect of the promotion be assessed. Advanced data science models are capable of estimating baseline sales with a high degree of accuracy, also taking into account such factors as seasonality, cannibalization, weather variability, calendar effects.
The examples presented are just some of the problems that are already being solved with the help of data science, and using the full potential of data can significantly affect a company’s position in the market.