When Ray Tomlinson, an American engineer and programmer, sent the first-ever email message in late 1971, he could not have realized what applications his invention would find. And he certainly wouldn’t have thought that someone would use this type of message to convince others to buy his products. Yet, more than 50 years after the first message, email marketing remains one of the most important channels for marketing communications. The challenge, however, remains in maintaining the effectiveness of this channel. AI tools can help with this. Before using them, however, it is worth asking yourself where to start?
Effective email marketing – how to get started?
I know that what I’m about to write, especially if someone reads it out of context, will sound trite, but sometimes it’s worth going back to the fundamentals. And the fundamental principle of email marketing can be summarized like this: if the customer doesn’t open the email, he won’t know what we wanted to communicate to him. And if he doesn’t, there will be no chance to perform the action we wanted to convince him to do. The adventure of email marketing should therefore start with getting the customer to open our mailing at all. Meanwhile, marketers know from their open rate statistics that usually most emails are ignored or even deleted without being opened. Why?
In our considerations, we will omit messages that are clearly spam. If I don’t know the sender’s address, didn’t sign up to receive such emails, or they look suspicious, the smartest thing I can do is delete them as soon as possible. So we are interested in all the other emails and the answer to the question of why recipients don’t read them. Well, according to a report by SARE, among the main reasons for deleting emails without opening them, recipients indicate:
- I get too many messages from one sender (31.9% of responses),
- the title is not interesting (33.4%).
These reasons account for more than 65% of all cases. Interestingly and positively from the point of view of those responsible for marketing communications, both of these factors are influenced by the sender and he is able to better target and personalize his email marketing efforts. So, it can be said that just send fewer messages to customers’ inboxes and write more interesting titles , and the return on investment will be higher. Simple, right? Unfortunately, we all know that’s not quite the case. I would even venture to say that in many cases it will simply be difficult.
Running mailing campaigns. How to improve their effectiveness?
For the first reason, the difficulty is determining how much is “too much.” Is once a week too much? Or is only once a day too much? Or maybe for one user three times a week is too much, but for another even four times a week is still ok? Or maybe… Well, that’s exactly it. The different scenarios are actually endless. It is impossible to list them all, let alone test them. On top of that, after all, we shouldn’t assume that a customer’s interest and patience are invariable over time. The only way to solve this confusing problem can be AI models based on machine learning. Based on historical and constantly incoming new data, they are able to make highly accurate predictions and optimize the appropriate shipping frequency for each individual consumer. In doing so, they are constantly improving and adapting to changes in consumer expectations. They are able to catch even very subtle signals of “overheating” of target groups and recommend reducing the rate. Someone may say: but all this looks complicated and probably expensive to implement and maintain, we’d better be careful and just send emails less often. It is hard to disagree with such a position. However, this is not the optimal strategy. With customers inclined to open your messages more often and respond with a purchase, you are losing a large portion of potential revenue this way. Thus, you are not using the potential of your contact base.
Let’s move on to the second problem, which is the uninteresting title. I can already hear the voices that appear in the heads of some of the readers. – He is about to write us something about testing and AI, and after all, we do testing without AI too, and a lot of it.
SARE’s report, cited earlier, shows that about 84% of senders conduct tests before sending campaigns. However, only less than 17% have A/B/X testing. One of the companies I have been in contact with, for example, conducts tests of the message title. Three variations of the title are prepared. Then a group of about 15% of the contact base is randomly selected. This group is divided into three equal parts, each of which receives one title variant. The variant that achieves the highest open-rate in the pilot mailing is then sent to the remaining 85% of the recipients. So we have testing, we have segmentation, we have optimization, it’s ok. However, the question that comes to mind is: what did you actually test and what question did you get the answer to? Did you definitely choose the best variant of the title, or only the best among the three proposed? How do you know that there are not 20 other variants, each of which is better than the winning one among the three tested? We don’t know, but even if we wanted to test more news topics we would get small groups. So what can we do to make the title in email marketing effective and translate into higher conversions?
Email marketing vs. Artificial Intelligence
Yes, some of the readers have surely already guessed, now it’s time to write about AI. Based on deep neural learning, the model is able, by accumulating data on currently and historically sent messages, to predict the response and estimate the most likely opening rate of any title. It will even work for a title you have never sent before. It really will. And even if the model is a little less sure of its prediction in such a case it will let you know. Just remember that a title alone is not enough information. After all, going back to the fundamentals (or clichés, as you prefer), it is important not only what we say but to whom we say it, and even when we say it. The same message can be understood completely differently: one will be pleased and the other will be offended.
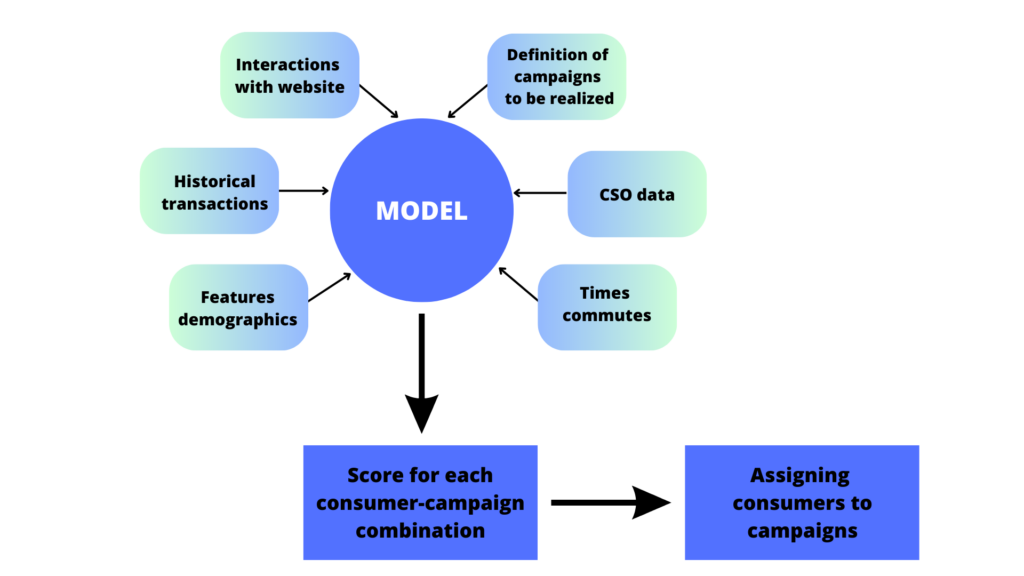
So an AI model that understands the title of the message, but is detached from the context, is not enough. Deprived of information about the groups of recipients, the characteristics of customers, the history of the company’s relationship with them, their purchase history, the moment. What is needed is a system that integrates data about these phenomena and provides the AI model with the appropriate context. The general scheme can be seen below.
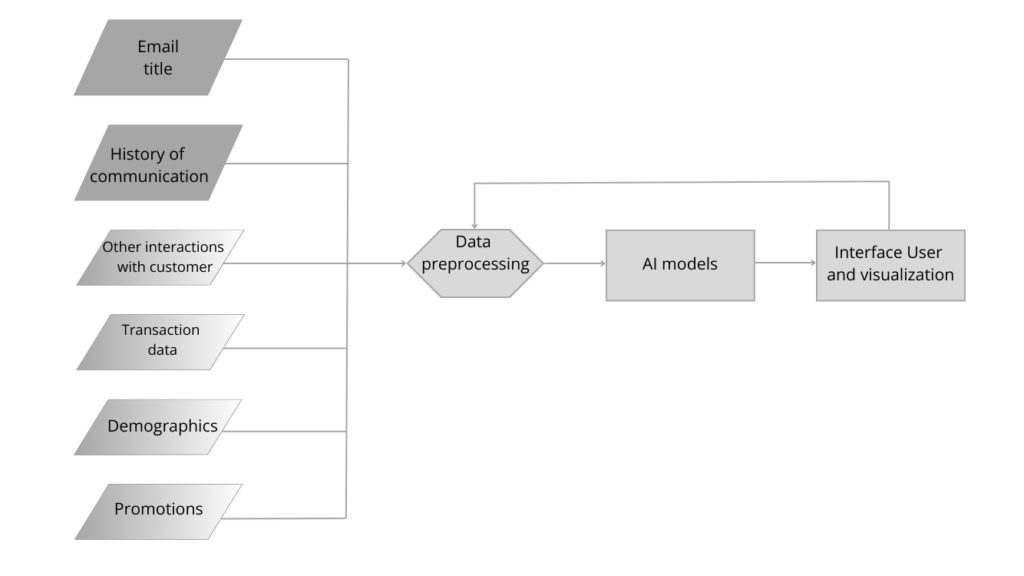
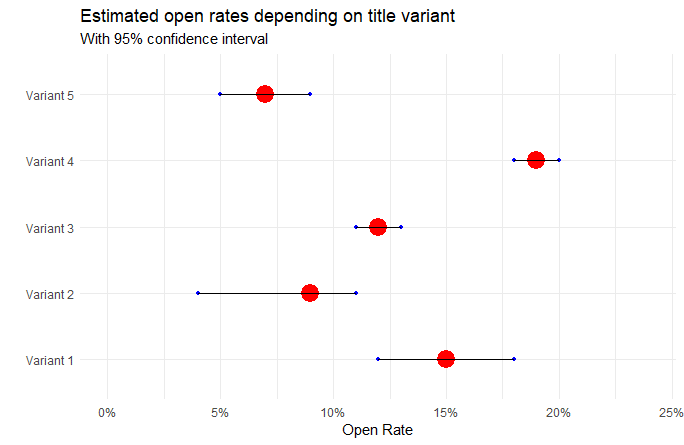
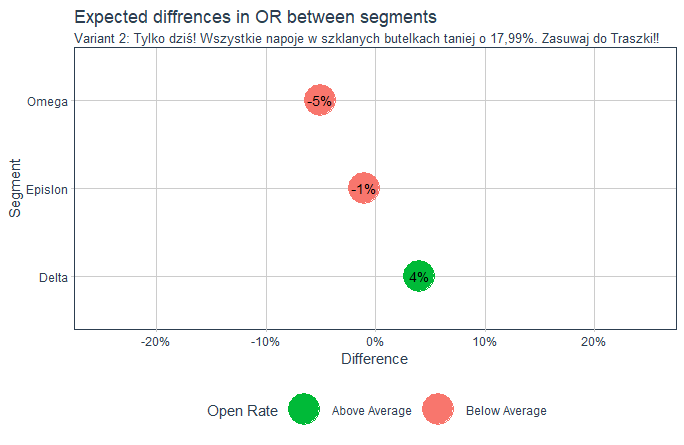
With a properly defined, trained and calibrated model, we can test different variants of titles and get information as in the examples below. The number of variants can be arbitrary, as can the number of segments. And best of all, we don’t have to send a single email to your recipients to run the test and estimate the expected open rate. We can conduct everything using a computer simulation.
Conducting effective email marketing – summary
When asked many years later what the content of the first email ever was, Ray Tomlinson said he couldn’t remember. The most important thing was that the message arrived at the recipient’s address. The content was not important. It didn’t matter at all. In marketing communications, the exact opposite is true. The mere arrival of an email is not enough. The content of the email is important. An interesting title is also important. Because without it, a significant portion of recipients will not read the content.