(R)ecency, (F)requency, (M)onetary value is a classic of marketing analysis. We all know it. Many of us use it. Each of us understands it. But do we really? RFM analysis undoubtedly has many advantages, which is why it has been in use for many years. However, it is also worth learning about its disadvantages and limitations. In order to use it properly and not try to solve problems with it that it cannot solve.
RFM in practice
The RFM approach is a customer segmentation method that is based on three main indicators:
- Recency (last purchase): determines how (in)long ago the customer made a purchase.
- Frequency (frequency of purchase): measures how often a customer makes purchases.
- Monetary (value of purchases): determines how much the customer spends during each purchase.
Assuming that we have data on customer transactions, we calculate the value of the three previously mentioned indicators (R, F, M) for each customer. Then we divide the values for each indicator into groups (for example, 3), where group I is the top 1/3 of customers in terms of a given indicator, group II to the middle 1/3 of customers, and group III is the weakest 1/3 of customers. For better understanding, let’s consider the example of a particular customer. This customer last made a purchase 15 days ago, which is quite recent. He buys on average 2 times a month, which is a high frequency for this consumer base. His average receipt, however, is a mere £50, which is a very low value compared to other customers.
Thus, our example customer is in the top groups in terms of R and F and in the weakest group due to M. Thus, he can be labeled R-1, F-1, M-3. With this division, the consumer can end up in 1 of 27 segments (3R x 3F x 3M = 27). It is worth noting that for each group can also be categorized into more than 3 compartments. It all depends on how many RFM segments you want to get. As I mentioned earlier – when dividing into 3 we get 27 segments. If we divide into 4 we get 64 segments. If we divide into 5 then the number of segments will increase up to 125. If we divide into 6 we will get 216 segments, and if we decide to divide the range of each of the 3 variables into 10 compartments then the total number of segments will reach as many as 1000.
What advantages does RFM have?
Among the advantages of the RFM approach we can point out:
- Simplicity and ease of interpretation – this is due to the small number of variables (three), the simple to explain manner in which the analysis is carried out and, consequently, the intuitive interpretation of the resulting segments.
- Relative speed of conducting the analysis.
- No need for specialized software.
- Relatively low requirements as to knowledge of statistical methods.
What does the simplicity of RFM analysis lead to?
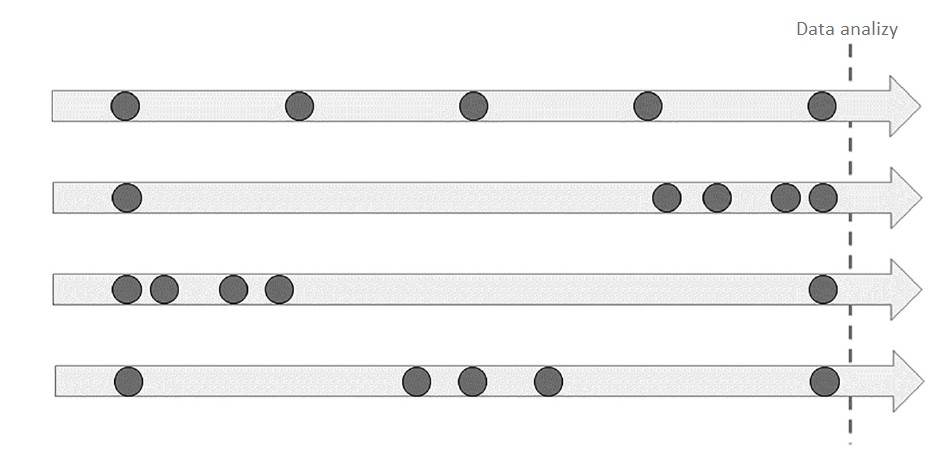
Unfortunately, listed among the advantages, simplicity is also the source of one of the most significant drawbacks of the RFM approach. Limiting the number of dimensions to 3 (R,F,M) makes it easier to interpret the results, but at the same time narrows the resulting consumer profile. Summarizing a consumer’s transactional activity using 3 numbers, is often an oversimplification. It can give a very distorted (and even falsified) picture of the customer. The following example illustrates this.
The diagram shows four customers with noticeably different buying patterns, but identical characteristics in terms of last purchase, frequency of purchase and seniority (first purchase).
The same problem also applies to the value of spending. A customer who always spends £50 and a customer who spends once £1 and once £99 will have the same average receipt value.
Another limitation of the RFM method is that it ignores non-transaction aspects of consumer behavior. For example, such as interactions with marketing communications directed to them, contacts with various points of contact with the company (e.g., complaints, calls to the call center) or demographic aspects (e.g., in some industries, frequency and spending may change with age).
Among the limitations of RFM, the focus on history is also worth mentioning. RFM summarizes consumer buying behavior from a certain point in time to a certain point in time. It helps to segment customers based on their past transactions. However, RFM says nothing about their future behavior. By itself, it has no predictive power.
There are various variations and expansions of the RFM model. New variables are added to it (e.g. RFD, RFE, RFM-I) or the way they are calculated is modified. The goal is to overcome the limitations mentioned earlier. However, they do not change the fundamental problem and that is the attempt to describe complex consumer behavior with a few aggregated numbers.
What is the RFM trap?
Thus, RFM can become a trap primarily when:
- it is the main (or even the only) tool we use to analyze and plan communication strategies and activities.
- RFM results are overinterpreted, i.e., conclusions are drawn from them for which the method provides no basis.
In the first case, we omit an important part of the consumer data that could be used, we work on the basis of a very narrow picture of the consumer, and we risk combining within a single segment consumers with completely different behavior patterns.
The second case is primarily about using RFM to predict future consumer behavior especially at the micro level. This can manifest itself, among other things, in the assumption that the consumer who achieves the highest values of RFM indicators will remain in the best “segment” in the future . This, of course, may be true. However, this is not determined solely by past purchases, but by many other factors that RFM, as a rule, does not take into account.
What are the alternatives to RFM?
As we noted earlier, the main limitations of using the RFM approach boil down to:
- An oversimplified view of the consumer and thus a high risk of segmentation error.
- Lack of predictive capabilities for consumer behavior.
Multidimensional segmentations based on machine learning are excellent for solving the first problem. In their case, the number of factors taken into account can be almost unlimited. Segments are defined algorithmically. Consumers are also assigned to them in the same way. The cost of greater detail is slightly more difficult interpretation. However, an experienced analyst can visualize segments in such a way that they are easily understood by managers.
The prediction problem is best solved with dedicated methods and algorithms for building predictive models. Such models are not only limited to the analysis of historical data, but recognize specific patterns of behavior that allow predictions of the future. Such prediction can be carried out at the level of a single consumer (rather than a segment) and allow full personalization of actions. Among the specific methods worth mentioning here are behavioral sequence models based on deep machine learning.
Summary
The well-known and popular RFM model can be a very useful tool. Provided, however, that it is properly interpreted and used with an awareness of its limitations. It’s a great tool to get a “bird’s eye view” of the consumer base. However, when you want a more detailed picture and a prediction of future consumer behavior, you should turn to tools specialized for solving such problems.

