We send up to a dozen different marketing messages to our customers in a week. Often the same audience participates in many different campaigns. We use various criteria for qualifying consumers for mailings. Usually different campaigns compete for the same “best” customers. We can’t always use control groups. Sometimes, by mistake, a control group gets syndicated. In the end, we ask ourselves: which of these actions had a real positive effect and translated into important indicators for us. Doesn’t this sound like an everyday occurrence in many companies?
Traditional approaches, like A/B testing or simple statistical models, fail in more complex situations where campaigns overlap, there are effects of confounding variables, and customer behavior varies. Bayesian causal inference offers an innovative and flexible alternative that addresses these challenges. Below, we will look at how the model works, its key advantages, and the limitations to be considered.
Challenges faced by marketers
Simple methods can only be effective under ideal laboratory conditions. The reality of the market, however, is far from them. Marketing faces many challenges that make it difficult to accurately assess the effectiveness of campaigns. We can point out here, among others:
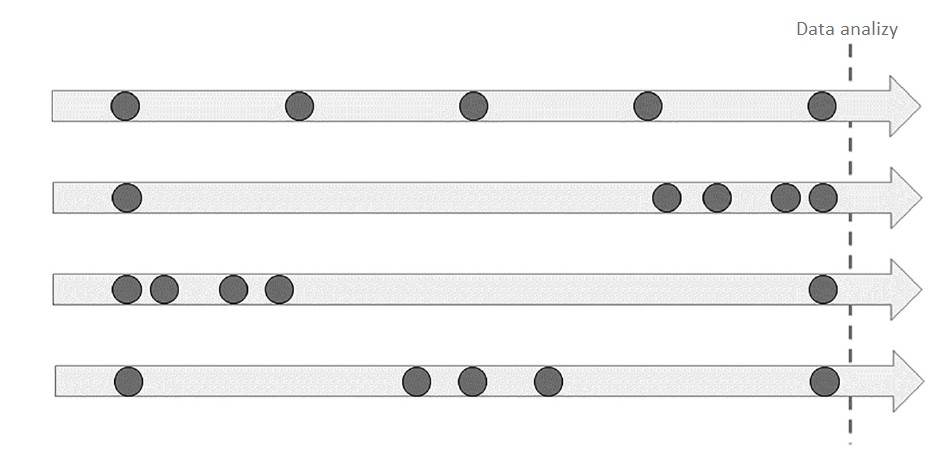
- Campaign overlap – customers often receive several marketing messages in a short period of time, making it difficult to attribute sales to a specific campaign. – customers often receive several marketing messages in a short period of time, making it difficult to attribute sales to a specific campaign.
- Criteria for assigning customers to campaigns – the selection of customers for a campaign is not random; higher-value customers may receive promotions more often, which can distort analysis results.
- Customer diversity – Customer responses to campaigns vary based on preferences, demographics and buying patterns. Overlooking these differences leads to results that do not reflect the true effectiveness of the campaign.
Bayesian causal inference addresses these challenges by taking into account varying customer behavior, overlapping campaigns, and the impact of customer selection on campaign outcomes.
What is Bayesian causal analysis?
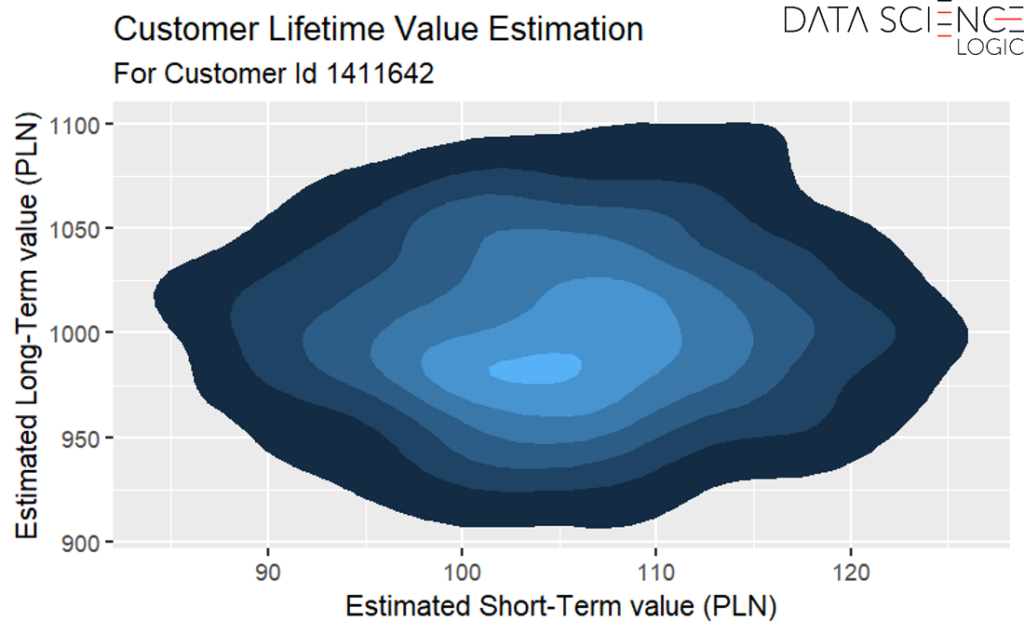
Bayesian causal analysis is a statistical method that makes it possible to assess the real impact of marketing campaigns on either sales or other key metrics (e.g., loyalty) for a marketer. This is achieved by building a model that describes the mutual influence of various factors on the generated consumer behavior. The model integrates the marketer’s prior knowledge (e.g., gleaned from analysis of previous campaigns), updates it based on available data, and then generates probability distributions for campaign effects and customer behavior.
Key Components of the Model
In a Bayesian model for causal analysis of marketing campaigns, three elements are key:
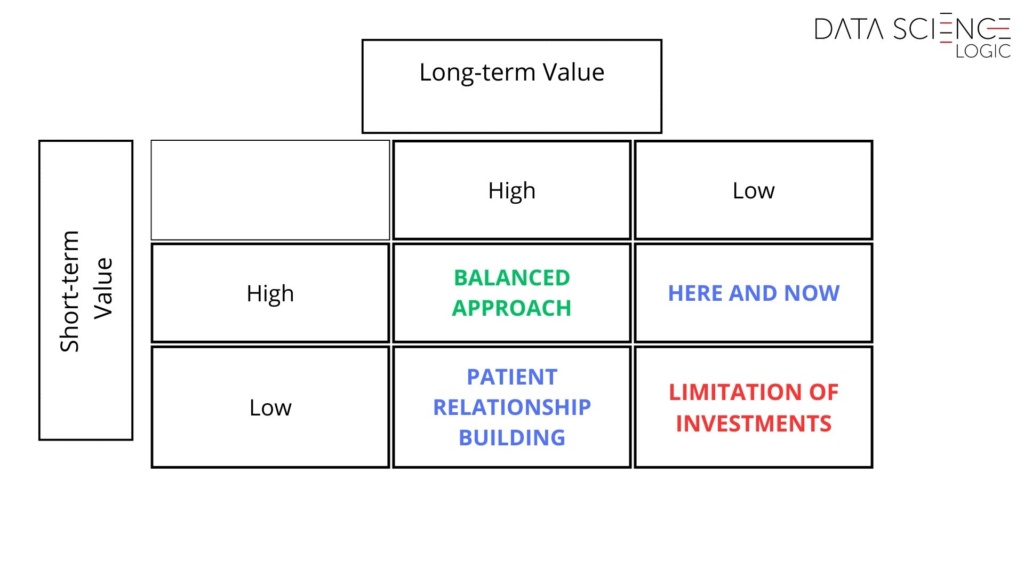
Baseline Purchase Propensity – Regardless of the campaign, every customer has a natural propensity to make their next purchase. This depends, for example, on their lifecycle stage, current attitude toward the brand, or financial situation. Properly modeling the baseline spending level, taking into account demographic, behavioral, and transactional characteristics, helps isolate the actual incremental impact of the campaign.
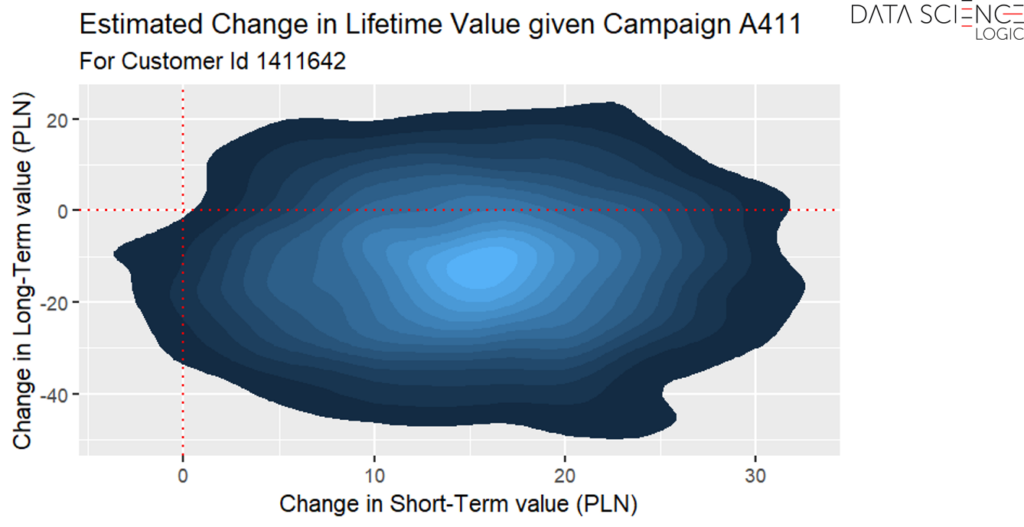
Campaign Impact – Each campaign included in the analysis has its probability distribution of impact on sales modeled separately. This allows an assessment of how much the campaign increases sales above the baseline spending level.
Hierarchical Structure – To ensure scalability and improve the interpretability of results, customers can be grouped into segments, such as by demographics or behavioral traits, with shared parameters for each group.
Advantages of Bayesian Causal Analysis in Marketing
- Attribution Accuracy – modeling separate parameters for campaign impact and baseline customer behavior allows overlapping campaign effects to be disentangled, resulting in more precise attribution of sales to specific activities.
- Resilience to Non-Random Campaign Selection – the model accounts for the selection criteria’s impact, giving it an edge over traditional methods. For example, wealthier customers might be more frequently targeted by certain campaigns. Without considering their natural tendency to spend more, the model would overestimate the actual campaign effect.
- Accounting for Customer Heterogeneity – the Bayesian method captures the diversity in customer behaviors and characteristics. The model reflects how these factors influence both baseline purchase propensity and the effectiveness of the campaign itself (as the same campaign may affect different customer groups in different ways).
- Precise Estimation of Uncertainty – the Bayesian method provides a full probability distribution of outcomes, offering better insight into the reliability of the estimates. This minimizes the risk of drawing incorrect conclusions from the analysis.
Limitations of the Bayesian Method
Like any methodology, Bayesian causal analysis has its limitations and challenges:
- Sensitivity to Initial Assumptions – with limited data, the method is quite sensitive to initial assumptions about the campaign’s presumed effectiveness. However, as more data becomes available, the influence of these prior assumptions diminishes.
- Analytical Expertise – While the results are straightforward to interpret and accessible to those without specialized data science knowledge, conducting the analysis requires advanced statistical, analytical, and programming skills.
- Technical Requirements – the method is computationally intensive, and analyzing large consumer databases with numerous campaigns demands advanced computational infrastructure. Properly adapting the model to available data and computational capacity can mitigate risks and challenges. This highlights the importance of skilled personnel conducting the analyses for the marketing department.
Conclusion
Bayesian causal analysis provides an accurate and scalable approach to evaluating the impact of marketing campaigns on key marketer metrics (e.g., sales, loyalty). The model accounts for customer heterogeneity, selection criteria impacts, and overlapping campaign effects, offering more precise results than traditional methods. While there are limitations, such as dependence on initial assumptions and computational complexity, the method delivers valuable insights that support data-driven decision-making. This enables marketing teams to better allocate budgets, tailor campaign strategies, and optimize customer communication, ultimately enhancing marketing spend efficiency.