Setting the correct price for a product or service is one of a retailer’s biggest, and most important, challenges in a competitive market. A price that is too low reduces revenue and, consequently, profit. Conversely, a price that is too high reduces demand and also reduces revenue. While the unit profit on sales is higher, it may not offset the losses associated with reduced volume.
Determining the optimal product price – where to start?
The difficulty in determining the optimal price of goods is due to the number and complexity of factors that affect it. These include the prices of complementary and substitute products. To the list can also be added promotions, advertising, the activity and offerings of competitors, the economic situation of customers, their tastes and preferences, the cost of purchasing goods, logistics issues. Additional challenges are associated with products whose demand is seasonal and is due to weather conditions, for example. A classic example of such an assortment is ice cream, the demand for which is closely related to the air temperature. Other such products that can be mentioned are sunglasses, skis, cool drinks, winter jackets, swimwear, hotel services, tourist flights.
The paradox of price
There is often a price paradox with these types of products. The classical economic theory of supply and demand says that the higher the price, the lower the demand for a good or service. This is usually the case. However, in the case of eminently seasonal products, this relationship can be shaken. After all, it often happens that the highest prices are quoted during the peak season for a given product. That is, when sales are highest as well. Sellers, knowing that it is during this period that consumers most need the product and are most likely to buy, take advantage of this by raising prices. A situation of this kind is illustrated in the chart below. You can see a gentle but clear positive relationship between price (horizontal axis) and volume sold (vertical axis).
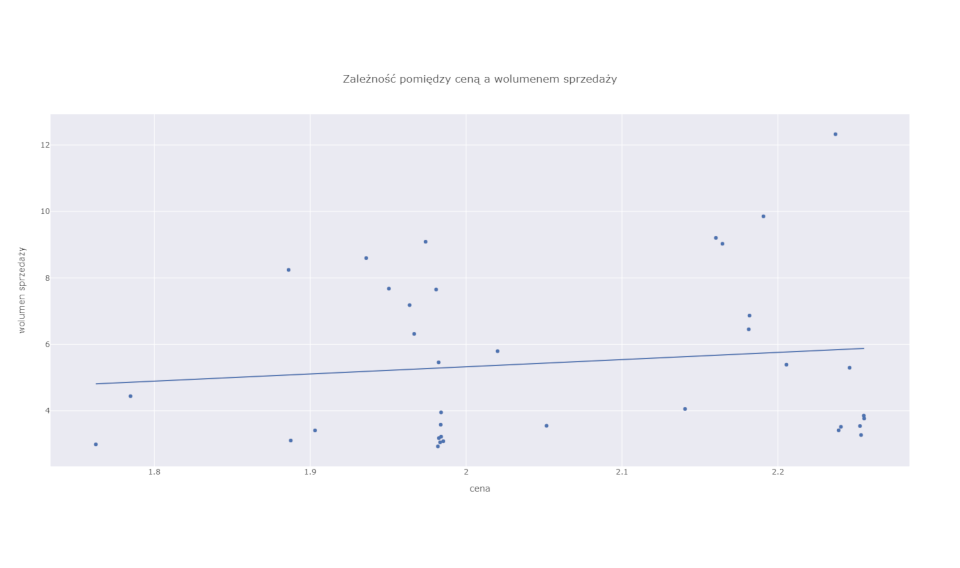
Just looking at this graph, which is essentially a simple price-demand model, one could draw the naive conclusion that raising prices increases sales. As we know, this is not true (except for a very narrow and specific group of luxury goods). By raising the price of ice cream between October and March, we will not succeed in increasing its sales.
The relationship observed in the graph is the result of the intertwining of two factors. First is the effect of price and air temperature on sales, and second is the effect of temperature (season) on price. The latter is precisely related to the seller’s decisions to adjust the price to the increased demand.
Is there an ideal price estimation tool?
Thus, solving the puzzle of the real effect of price on sales requires a somewhat more complex approach than the analysis of the correlation between price and demand (an example of which was illustrated in the previous chart). Randomized experiments (e.g., A/B tests) are the ideal tool for estimating such effects. In theory, one could imagine that a retailer would randomly change prices so as to test different variations and combinations – resulting, for example, in an increase in the price of ice cream in December, or its drastic reduction in an exceptionally hot June. In practice, however, this is hardly feasible, and if only on a small scale and for a limited time. This is because it is a very expensive experiment.
Selling products at suboptimal prices drains revenue. In addition, frequent and unpredictable price changes can negatively affect consumers’ experience and induce them to switch to competitors. A practical solution, then, is to use the data we already have that are not from the experiment to estimate the effect of the factor of interest (in this case, price) on the outcome that is important to us (in this case, sales). It is possible, although it should be noted that this is not a trivial task and requires an elaborate mathematical apparatus. In today’s article, however, I will not focus on the mathematical, statistical and philosophical nuances involved in causality analysis. Instead, I will show the possible results of this kind of analysis and their practical effects.
Seasonality vs. product price
The solution requires at the outset the imposition of a “model” on the data that reflects our understanding of how the system we want to analyze works. This requires both common sense and expert knowledge. We can describe our assumptions using a graph, as illustrated below.

First of all, as you can see, we set assumptions as to the direction of influence of the various variables. The price changes under the influence of temperature (or, more precisely, by the actions of the retailer resulting from his knowledge of the effect of temperature on consumer behavior). The retailer, on the other hand, by changing the price, is not able to change the air temperature – I think this is not a controversial assumption – hence the arrow points in only one direction. Temperature also has a direct effect on sales (when it’s warm more people are eager for ice cream). In addition, we take into account that other factors that are beyond our observation may also affect the price and affect sales. This is, of course, a very simplified model and can easily be expanded to include other factors that affect price or sales.
Estimation of the actual effect of price on sales
Based on such a formulated model and historical data on price, volume and temperature, using advanced analytical methods, it is possible to estimate the actual effect of price on sales. In other words, we can estimate to what extent a change in price is the cause of a change in sales volume. From there, it’s only a step to putting this knowledge into practice and optimizing the price.
The following example shows the process of finding the optimal price for ice cream in the month of September with a forecasted average daily temperature of 14.2 degrees C. We can generate similar charts for any temperature value, which is important in this case. This is because the optimal price will be different when September is exceptionally warm, and different when there are records of cold weather.

September is a transitional month between the peak season and the autumn-winter season. So far, the retailer has traditionally kept product prices still quite high in September. On the horizontal axis of the graph we show the change in price relative to the base price – this is indicated by the 0 line near the center of the graph. The blue curve shows how sales revenue changes depending on the price adopted. Moving to the right of line 0 (i.e., increasing the price), we observe a decrease in revenue. A higher price negatively affects demand, and higher unit revenue does not compensate for the decrease in will. Moving to the left of the 0 line, we observe an increase in revenue, although only up to a certain point. Beyond it, increased sales volume ceases to compensate for the drop in price. This point marks the point of optimal price – indicated by the vertical dashed line. The model suggests that the optimal price is 80 cents lower than the existing base price.
Following the recommendation and lowering the price results in an increase in turnover of just over 26% compared to the base scenario. This is illustrated in the chart below.

The method presented in the article offers tremendous opportunities, using the latest research advances in artificial intelligence and causal analysis. In practice, of course, for greater accuracy, the model should also take into account additional factors such as prices of other products, prices at competitors, advertisements, flyers, newspapers, offers, promotions, macroeconomic factors. The full solution also gives much more in-depth insights. Simulating the impact of pricing decisions on sales volume and revenue helps you make better decisions. These, in turn, translate into measurable financial results and can give a significant competitive advantage.

