Loyalty program dashboard

Problem:

One of the retailers needed easy access to information about its loyalty program participant database. The information had to be legible, easily accessible and regularly updated.One of the retailers needed easy access to information about its loyalty program participant database. The information had to be legible, easily accessible and regularly updated.


Solution:

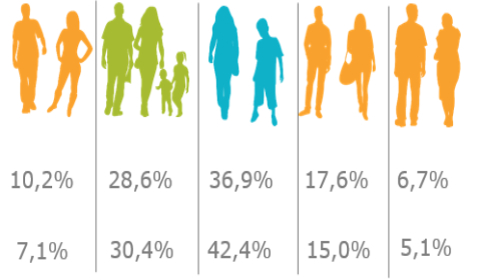
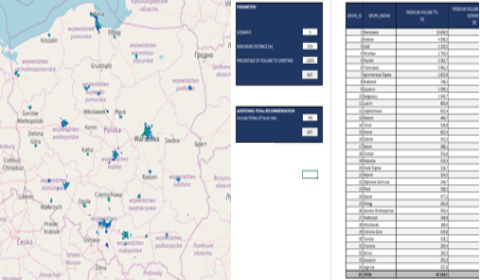
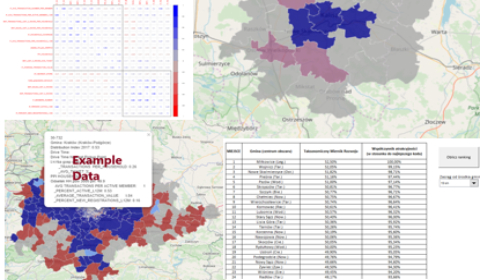
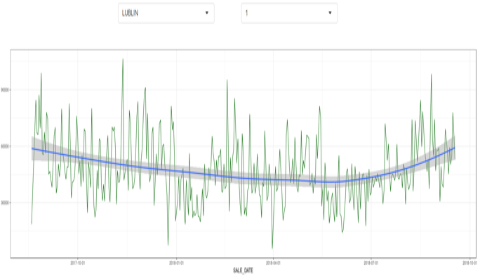
An interactive dashboard was built to present the most important information in a clear form. The dashboard is updated daily based on the loyalty program database and other data sources.

Effects:

  • Always up-to-date and legible information for managers responsible for the program
  • Good decisions translated into an almost twofold increase in the number of participants in the program in less than 2 years
  • EMAIL and SMS communication to program participants brought between PLN50 and 100 million of additional turnover per year

Data sources:

  • Data from the loyalty program
  • Sales data
  • Data from the mailing system

Segmentation of the customer database

Problem:

One of the retailers, in order to diversify its offer and communication, wanted to distinguish business-relevant segments in a database of almost 4 million registered consumers.


Rozwiązanie:

Using machine learning methods, 5 customer segments were identified based on nearly 100 variables. These segments were characterised and described for marketing purposes. Each customer in the database was assigned a segment with the possibility of periodical automatic refreshing.

Effects:

  • Automation of the cyclic segmentation refreshing allows to save time for marketing and analytic tasks by approx. 40%
  • Adjustment of the offer and language to the customer segment
  • Tracking customer migration between segments in time
  • Possibility to assess the increase in effectiveness of marketing activities addressed to a specific segment

Data sources:

  • Sales data
  • Product data
  • Promotion calendar

Choosing the optimal distribution network

Problem:

When introducing a new product on the market, one of the FMCG companies needed to decide which distribution networks to cooperate with. The aim was to ensure product availability in target groups in the most important cities in Poland while limiting the number of partners.


Solution:

A tool was built to simulate target market coverage depending on the selected network and other parameters. Business users can change simulation assumptions and test different scenarios themselves.

Effects:

  • Possibility to simulate and evaluate different decision options
  • Optimisation of distribution costs

Data Sources:

  • Sales data
  • Demographic data (Central Statistical Office of Poland, external suppliers)
  • Point of sale network data; Distances/time to arrive

Selection of areas for catalogue distribution

Problem:

High printing and distribution costs mean that paper catalogues are prepared in limited editions.  It is necessary to decide in which areas to carry out the distribution.


Solution:

A tool for the marketing department has been developed, creating a ranking of areas based on several variables with the possibility of determining their weights by a business user. The solution was nationwide (it concerned all the regions in which the retailer operated).

Effects:

  • Saves time and effort (by about 30%) for the marketing department
  • Increase in efficiency of operations (in the first year, thanks to the recommendations of the model, approximately 20% of the circulation was reallocated)

Data sources:

  • Transaction systems; Loyalty program
  • Demographic data (Central Statistical Office of Poland, external suppliers)
  • Internal surveys and studies