The stationary sales in the vast majority of industries plays a key role. Despite the observed dynamic growth of e-commerce, this will not change in the coming years. The opening of a new point of sale usually entails a significant investment related to the construction or rental and adaptation of premises, recruitment of employees as well as changes in logistics. Additionally, the potential negative impact of a new outlet on the existing ones is significant. Therefore, decisions to expand the sales network are associated with high risk. In today’s article, we will show how data science combined with geospatial data can help mitigate these risks and facilitate better decisions.
Key questions
In the context of point-of-sale locations, questions that data science can help answer include:
1) Is this a good place to open a new store?
2) Will the new store not “cannibalize” the sales of my existing stores?
3) How many stores should I open, where should I open them, what should the optimal network look like?
4)Which stores should I close? What will be the net effect of closing a store?
5) Is the existing store using the potential of its location?
6) If I don’t open a store in a particular location but a competitor does, will my existing stores be negatively affected? Which ones? How much?
Today I would like to focus on the first two questions and show you how data analysis can help you make the right decisions.
Data, data, data…
To begin with, it is worth taking a moment to look at the sources of the data used in the analysis. These can be divided into internal data and externally necessary data. Key internal data includes:
– historical sales data,
– outlet characteristics (space, nature of location – gallery, stand-alone, etc., range of assortment available)
– local activity (promotions, media presence, leaflets, newspapers, billboards),
– address data of points.
The data that need to be obtained from outside are mainly:
– data on population, demographic characteristics (age group distribution, gender), income and purchasing power,
– Data about the road network, its quality/class and traffic volume,
– geolocation of competition points,
– travel time to own and competitors’ outlets by different modes of transport (depending on the nature and density of the sales network, different modes of transport may be relevant).
Some data may be available only at the level of the whole municipality (especially data from the Central Statistical Office), but where possible data of the highest granularity should be used. There are sources from which data can be obtained for individual address points (specific blocks).
When analyzing and presenting data, a reasonable compromise between detail and total may be a so-called kilometer grid. The map is then divided into squares of 1km side length. Examples of such maps will appear later in this article.
Why is accurate geographic data important?
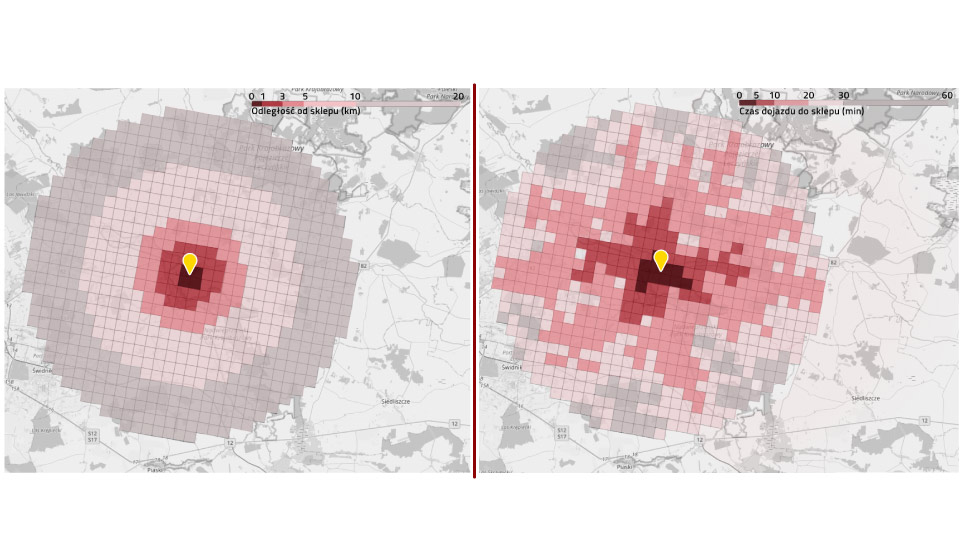
Below is a simple example of the differences in conclusions that can be reached depending on the data available. The map on the left shows the distance from the store (up to 20 km). This is a very simple measure to calculate. One might think that it would be a sufficient approximation of the time to get to the store. Unfortunately, as you can see in the map on the right, taking into account the distance from the store alone is misleading. Only showing the actual travel time on the map shows a realistic picture of the store’s range. It can be seen that the store’s range extends along traffic routes (in this example, radially spread), and areas that are close to each other in reality may have different travel times. Over-simplification and abandonment of accurate geographic data leads to incorrect estimation of store potential and potentially wrong decisions.
In which direction is it profitable to develop a chain?
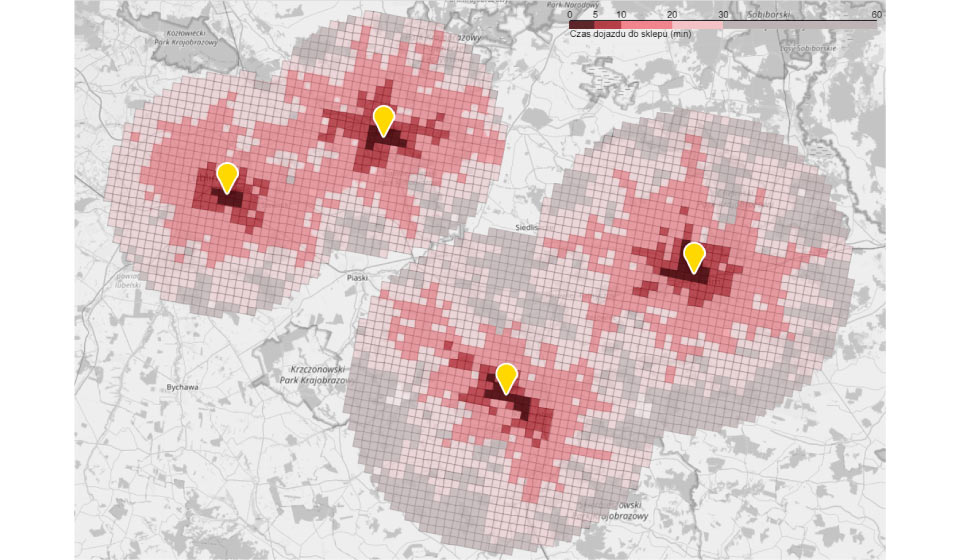
We will now analyze the example of a chain currently consisting of 4 stores. On the map below you can see their range. From each area (square) the travel time to the nearest store has been calculated. The management is considering various scenarios for further development. One of them is to fill the “white spots” in the network coverage. Such a move could be interesting for at least two reasons. First, there is a town in the area with what appears to be demographic potential where a new outlet could be located. Second, a new store created between existing stores could fit perfectly into the existing logistics chain.
To base the decision on data, an estimation of the new store’s potential is made and its impact on the existing network is simulated.
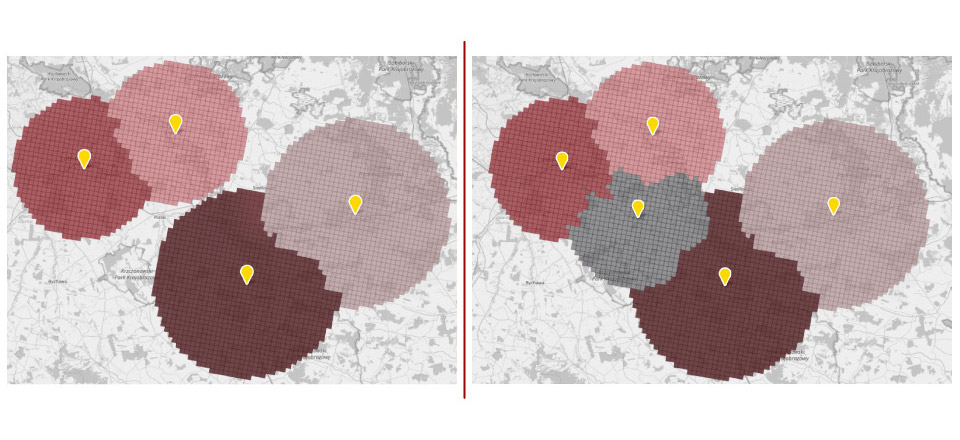
The map on the left shows the range of stores before expansion. Areas were assigned to the store with the shortest travel time. The map on the right illustrates how the coverage of existing locations will change after the network expansion and what the coverage of the new outlet will be. It can be clearly seen that the overall network coverage will be expanded to include new areas. You can also see that the areas of all but one of the existing stores will be slightly depleted. However, a visual assessment and map analysis is not enough to make a decision. Precise forecasts are needed. Only accurate numbers will allow to estimate the profitability of the considered investment.
Predictive model
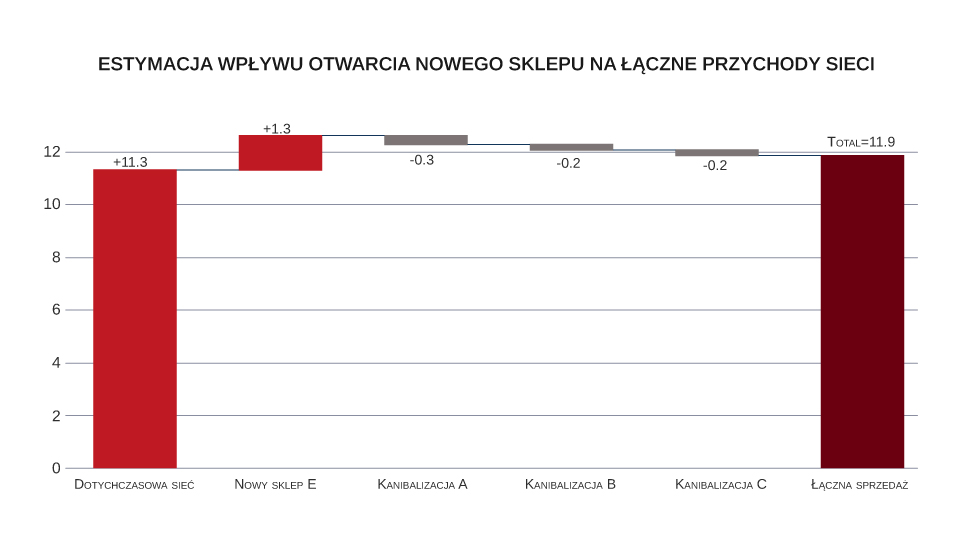
With help comes a predictive model built on machine learning. Using a wide range of available data (sales, demographics, geography), the model allows for accurate estimation of a new store’s potential and its impact on existing outlets. The graph below shows the modeling results. The bar on the left (‘Existing chain’) represents the baseline, i.e. the projected sales level of the entire chain if the new store had not been launched. The next bar is the sales estimate for the new outlet. The result shows that it will increase the potential of the chain. However, compared to others, its contribution will be relatively lower. The new outlet will increase the chain’s turnover by about 12%. The next bars show the cannibalization of sales in the existing points. As could be guessed from the map analysis, 3 out of 4 stores will be affected by cannibalization. It may seem that no store will suffer significantly – on average only by about 6% of turnover. However, it will account for as much as 54% of the new outlet’s sales. Thus, most of the new store’s turnover would be realized at the expense of the existing stores, and the incremental impact of the new point on the chain’s total turnover would be only about 5%.
The final decision about the profitability of investment in opening a store in the considered location requires comparing incremental turnover (and margin) with the necessary expenditures and operating costs. The analysis should also include a margin forecast, as it may turn out that the new store will differ from the existing ones in terms of a typical basket of products and, consequently, their margins. It is certainly worth considering other potential locations, as the return on investment there could turn out to be higher. Additionally, the possible actions of potential competitors should also be taken into consideration. The most appropriate course of action would be to conduct a comprehensive analysis and simulation covering many potential locations.
Modern optimization methods, which we use on a daily basis in Data Science Logic projects, allow us to simulate many parallel scenarios and find the optimal shape of the network. Thanks to this, they are able to indicate which locations are worth opening and which should be closed. The final decisions always belong to people, but precise data combined with appropriate methods of analysis can help to make them.
Want to know more about customer traffic in stationary stores? Read the details of the hourly traffic forecast project and see how it will help increase sales.

