Promoting a product, especially one that involves a reduction in its price, almost always results in an increase in sales. But does every increase mean that the promotion was profitable? How often does the promoted product take customers away from other substitute products? How to calculate how much is the actual “incremental” of the action?
The fundamental question to solve the problems identified in the introduction is: what if… Or more precisely: what if there were no promotion. How much would the sales of the promoted product have been? How much would other products (especially substitute products for the promoted one) have sold? On the surface, this seems impossible to determine. After all, we are asking about an alternative reality that we are unable to observe. It is impossible to introduce a promotion and not introduce it at the same time. However, it turns out that based on advances in statistics, data science and artificial intelligence research in recent years, we are able to estimate the aforementioned effects in a scientific, methodical and rigorous manner. The method used is based on so-called synthetic control groups. That is, to put it somewhat simply, comparison groups created by a special algorithm on the basis of available observations of sales of similar products.
We will analyze this using the example illustrated in the chart below. The red line shows the actual sales of the product (in units). You can see that before March, sales of the product were traceable. You can also see a clear weekly cycle with peaks on Saturdays and clear declines on Sundays (related to the trade ban and the limited number of outlets that can conduct sales). One can also see an upward trend in sales since the beginning of March. The black vertical dashed line shows the day the promotion started. The price of the product has been significantly reduced. A clear increase in sales can be seen.
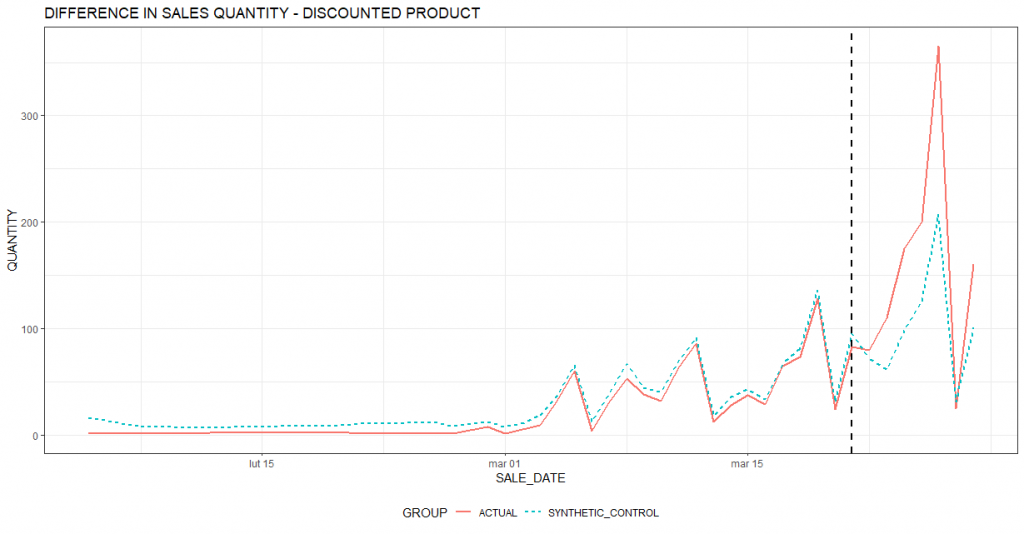
The light blue dashed line is the algorithm’s estimated sales behavior of the promoted product if there were no promotion (alternative reality). It can be seen that even without the promotion there would have been an increase in sales (in line with the upward trend visible since the beginning of March). However, it would not have been as large. Therefore, it can be concluded that the promotion generated additional sales of the product.
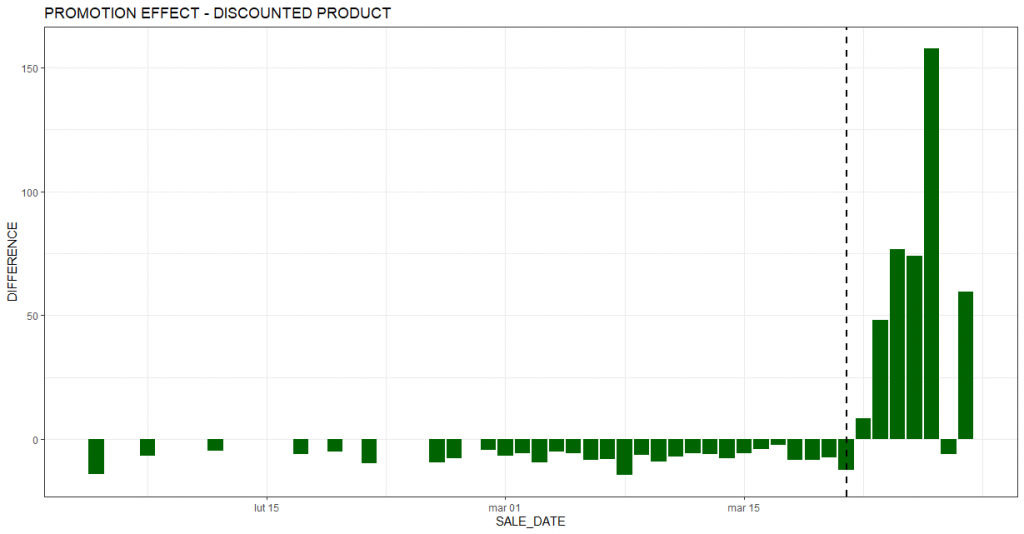
The next chart shows a summary of incremental sales for each day. As in the earlier chart, the black vertical dashed line marks the beginning of the promotion period. Most of the bars are clearly above zero, indicating an estimated increase in sales relative to the base scenario (i.e., no promotion). The period preceding the promotion to the left of the dashed line is the calibration period. Based on this period, the algorithm learns the best combination of products that make up the comparison group (the so-called synthetic control group). The closer the bars in the calibration period are to zero, the better the matched comparison group. Of course, in real-world examples (such as the one presented in this article) it is difficult to find a perfect match. Hence, the bars deviate slightly from 0. What is important, however, is that the magnitude of these deviations is much smaller in the calibration period. This lends credence to the conclusion of a real positive effect of promotions on sales.
At this point, one could close the analysis and congratulate those responsible for the promotion. The question arises, however, to what extent the promotion attracted new customers or increased demand from existing ones, and to what extent it merely shifted demand from other complementary products that were not promoted during the period. In other words, to what extent did the promotion scanibalize sales of other products.
To answer this question, we will conduct a similar analysis to the one presented above. This time, however, the red line will represent sales of a substitute product to the promoted product. For this particular product, we want to estimate the cannibalization effect.
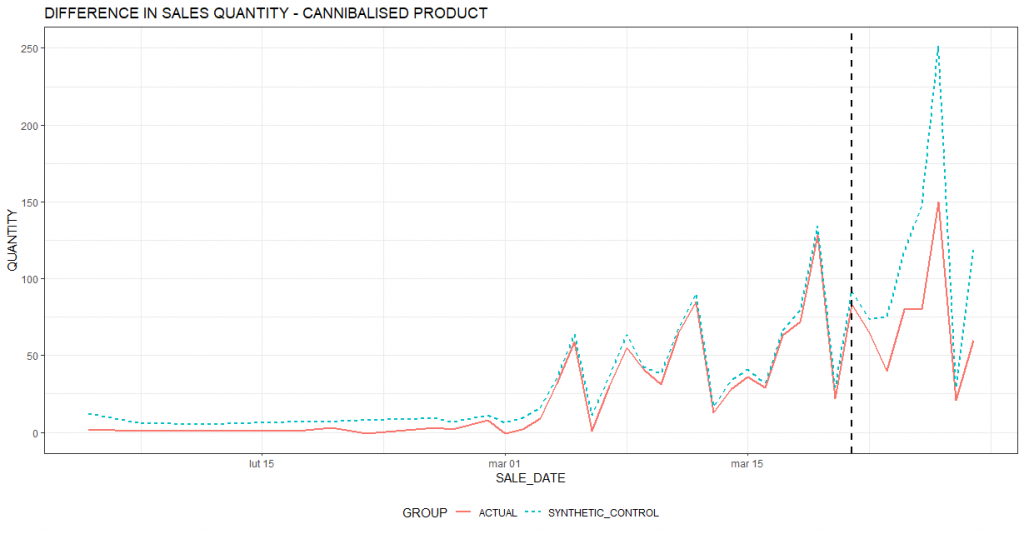
As before, the vertical black dashed line marks the date of the start of the action. After the start of the promotion, the red line is lower than the light blue dashed line, which means that the substitute product is sold less than it would have been sold in the baseline scenario assuming no promotion. It is also worth noting that in the period before the promotion (the calibration period) the two lines are very close to each other, which means that the algorithm has correctly calibrated the comparison group.
The chart below summarizes the effect of cannibalization by day. You can see that on each day of the promotional period the product sold less compared to the reality that the promotion would not have taken place.
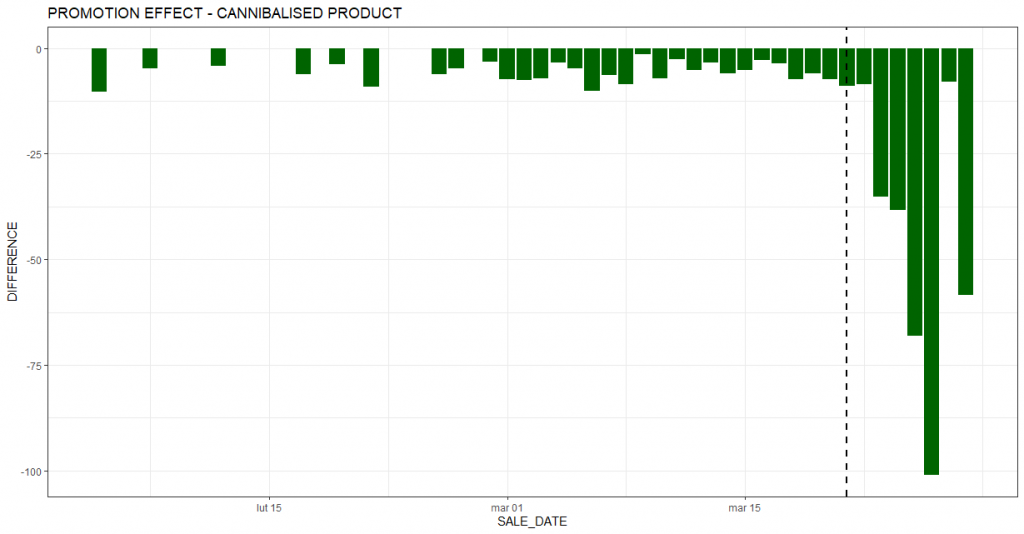
In the case analyzed, the incremental sales of the promoted product amounted to 407 units. However, when evaluating a promotional action, one must take into account the effect of cannibalization. In this case, the loss of sales on a product substitutable to the promoted product amounted to 326 units during the promotional period. Without taking this factor into account, we could significantly overestimate the financial effect of the action and draw incorrect conclusions as to its profitability. This, in turn, could translate into suboptimal decisions on organizing similar promotions in the future.
The best way to measure effects is to conduct a randomized experiment. However, this is not always possible. It is difficult to imagine how to run a promotion and not run it at the same time and for the same group of consumers. In such situations, modern analytical methods based on synthetic control groups, among others, such as the one presented in today’s article, can be invaluable in marketing analysis.

