NPS (Net Promoter Score) survey has been known for nearly 20 years. Described in a Harvard Business Review article by Frederick F. Reichheld, NPS was well received by marketers and was adopted by many industries. It is estimated that up to two thirds of the largest US companies (included in Fortune 1000) use NPS.
The basic version of the survey includes only one simple question: On a scale of 0 to 10, how likely are you to recommend the company to a friend?
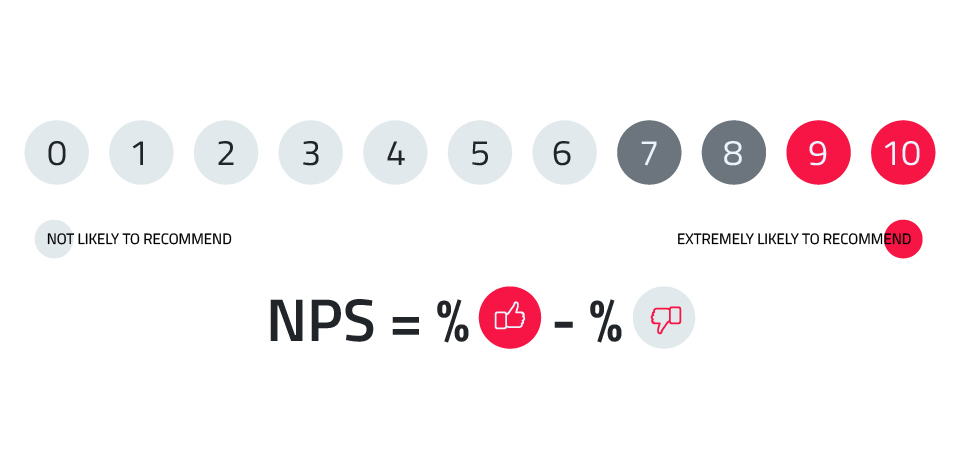
The respondents who answer 9 or 10 are referred to as promoters. They are brand ambassadors. They are worth pursuing because each one of them recommends the brand to up to 3 more people. Those with a score of 0 to 6 are detractors — unhappy customers tend to tell about it to 9 other people. The scores of 7 and 8 are considered neutral and are disregarded in determining the final score.
Advantages of the NPS survey
The NPS customer loyalty evaluation tool has several important advantages. Above all, these include a relatively simple survey, to which a customer can respond easily (the questionnaire is short and the question is simple) and an uncomplicated way of calculating the result. More important, a significant correlation has been shown between NPS and revenue growth rates. The examples for various industries can be found, among others, in the aforementioned Reichheld’s article. The analyses conducted on the Polish market show a relationship between the consumers’ NPS score and their purchasing behaviour, and even their inclination to interact with a brand. In today’s episode of the ‘We Love Data, So Let’s Date’ series, we would like to present one of such analyses.
In this article, we will focus on the opportunities offered by the analysis of de-anonymised responses given in an NPS survey. You must also remember that the lack of anonymity here does not mean knowing the respondent’s exact personal data, but rather being able to track their subsequent interactions with the brand, their purchase decisions and linking them to the NPS score. Is it possible to clearly determine to what extent the knowledge of a consumer’s attitude towards a brand expressed in an NPS survey can help optimise and personalise marketing communications?
Survey Conducted by Data Science Logic
The presented results come from a study conducted on a sample of over 20,000 participants of a loyalty program of one of the largest retailers in Poland. We took into account the participants’ behaviours and their interactions with the brand in a period of 6 months after completing the survey. Thanks to an extensive consumer identification system, it was possible to track participants’ actions in various channels, including purchases in brick-and-mortar stores, online purchases, visits to the brand’s website, interaction with mailings (open rate, click rate) and text messages, as well as interactions with digital ads displayed on external websites.
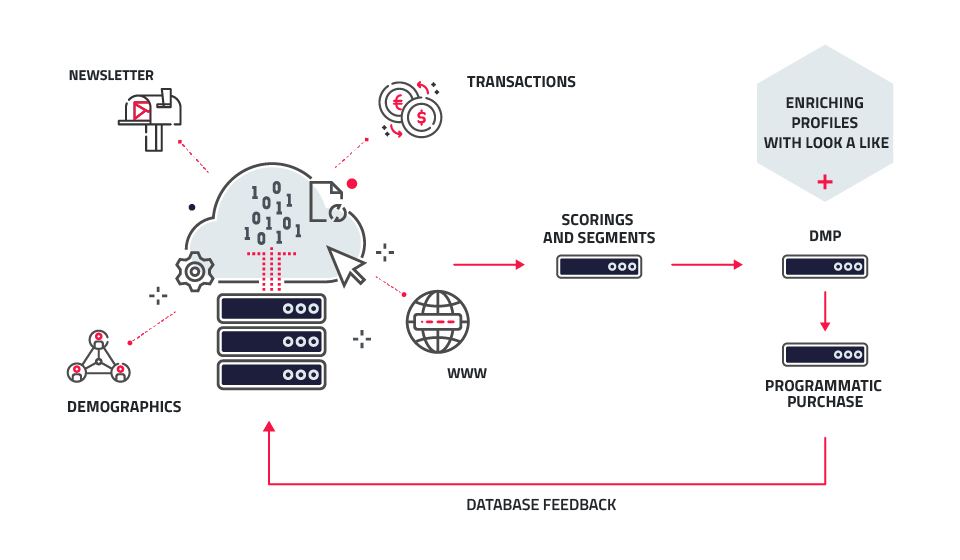
General diagram of consumer data flow
The conclusions from this study confirm the previously quoted observations and theses that point towards a definitely higher value of customer who displays a positive attitude towards the brand. The greater value of the customer-promoter is also influenced by their openness to communication activities conducted by the brand. Promoters had a 12% higher click rate compared to detractors. So they were clearly more likely to read the newsletter content and respond with clicks.
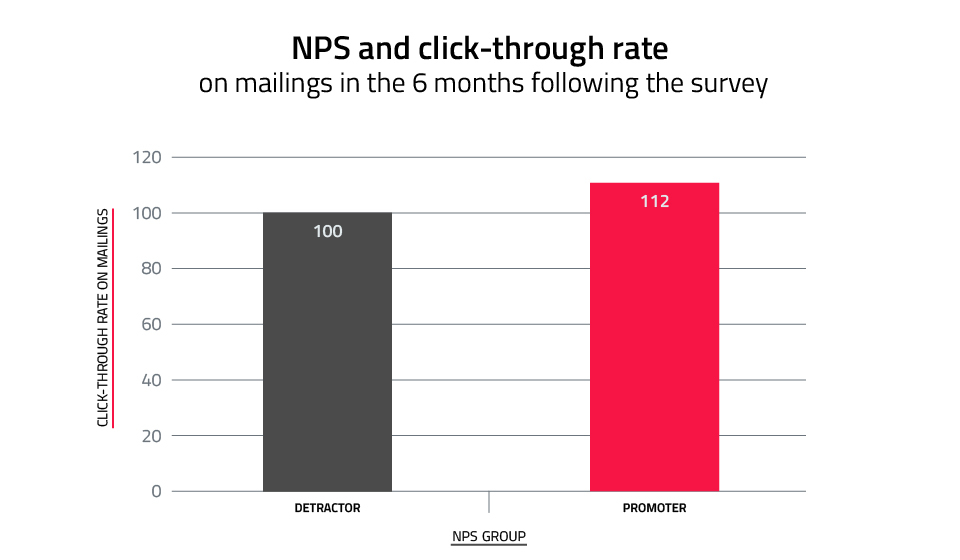
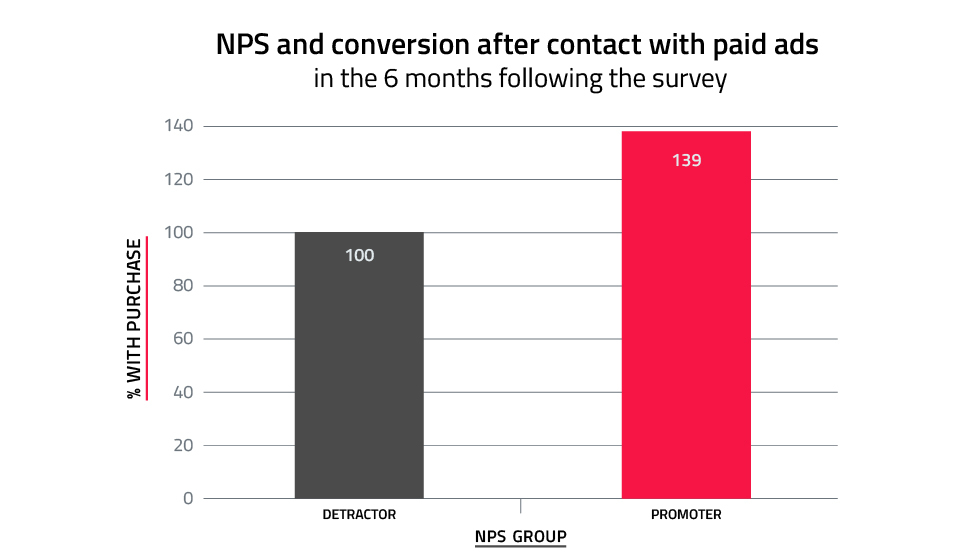
In order to facilitate the analysis of the results of this survey, the numbers in the above graph, and in the following ones presented in the article, are indexed in such a way that the values of the analysed feature for detractors is set at 100, and its value for promoters is proportionally higher or lower.
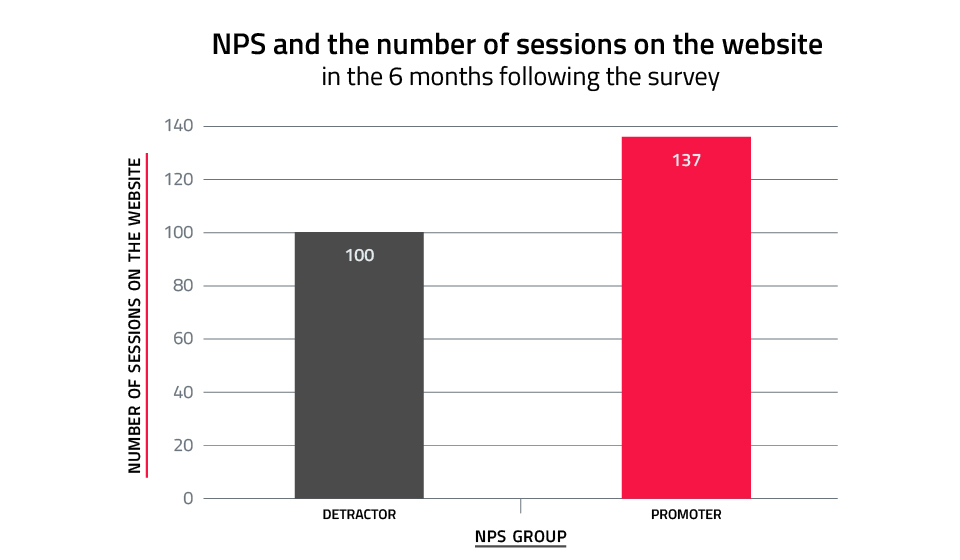
Higher click-through rates on mailings linking to a website or e-commerce site translated into a higher number of sessions on the website by up to 37%.
As it turns out, promoters reacted much more actively to brand messages in external media. Compared to detractors, they had nearly 40% higher interest in the communication after exposure to digital ads.
Positive attitude towards the brand, significant openness to newsletter communication and a greater willingness to respond to advertising messages translate into higher customer spending. In the period of 6 months after completing the survey, the promoters spent 11% more compared to brand detractors.
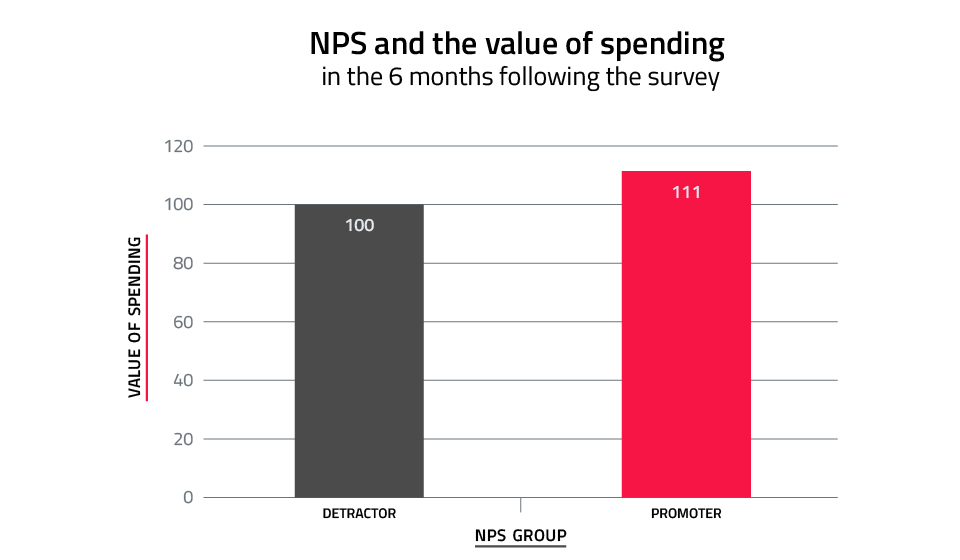
It is worth noting that this difference is the result of both higher frequency of transactions and higher average value of a single transaction.
So How Can You Use the Insights from NPS Analysis to Communicate More Effectively?
Data Science Logic decided that one idea in particular is worth verifying, i.e. how the adjustment of the frequency of paid media exposure impacts the consumer’s most recent NPS score. This proved to be an interesting lead. Based on the data analysed, it was clear that promoters and detractors respond differently to escalating communication intensity. Their ad saturation curve is completely different. In the case of promoters, increased frequency of exposure initially results in an increase in response. Advertising message overload was achieved with 6 contacts. For detractors, however, the initial effect of increasing the number of contacts was negative. Only after exceeding 8 ad displays the effect was comparable to the promoters group.
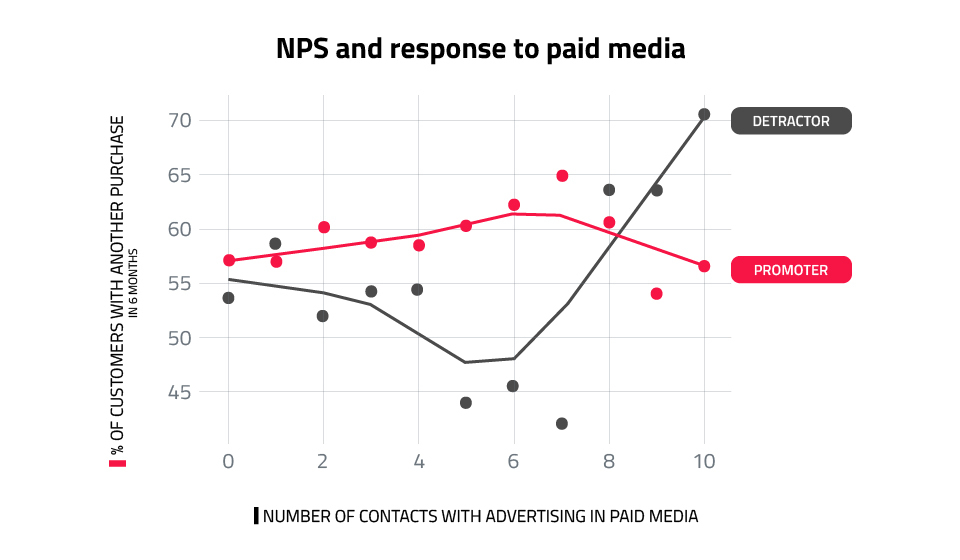
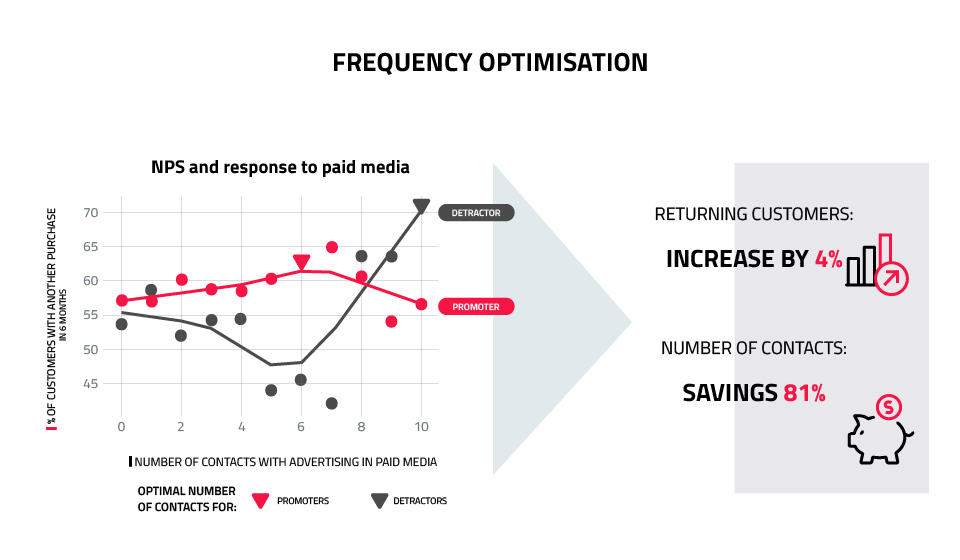
Using these observations to optimise the number of ad displays, you can assume 6 is the limit for promoters. If you have not convinced the promoter within this time, you should let go of further attempts. This saves budget and reduces the risk of over-saturating the consumer with ads, thus preventing the promoter to join the group of unhappy customers. However, you should adopt completely different guidelines for detractors. In their case, it pays to aim for 8 or more ad displays. By applying the described optimisation, you could significantly reduce the number of contacts and save up to 80% of the budget, with the same effect (or even potentially slightly better, i.e. by 4%). Our analysis assumes that we only affect the frequency of communication, leaving everything else unchanged.
Further efficiencies can be gained by also testing the differentiation of consumer-facing content depending on the consumer’s last and previous NPS score. This applies to both paid advertising and communication based on own media: mailing, text messages, website personalisation.
Summary
So, to sum up the presented results, it should be noted that they depend on the conditions specific to a particular company, e.g. on the industry, frequency of purchases, nature and activity of the competition, consumer features. It is therefore worth conducting a similar analysis using your own data. To do this, you will need an NPS survey, conducted systematically in a way that allows you to link responses to a consumer identifier, and covers a wide range of channels in which consumer interactions with the brand are tracked. The wider the range of points of contact with the brand, where you can register consumer behaviour, the greater the possibilities to optimise the activities. NPS survey data can be a valuable addition, opening up additional opportunities.
Net Promoter Score is more than just a question. It allows you to get to know your customers better. NPS is a strong indicator of loyalty and, as it turns out, can be used to optimise marketing communications. Asking one simple question will help you reduce your paid media costs and reach the right customers with the right message. Of course, as long as you combine the answers you get with other valuable information about your customers.

